In May 2025 I had 13x Aiko 2S solar panels installed on my home. This post is a detailed breakdown of my first 7 months with the system - covering generation, consumption, battery cycling, grid import/export, and the financial impact on my energy bills.
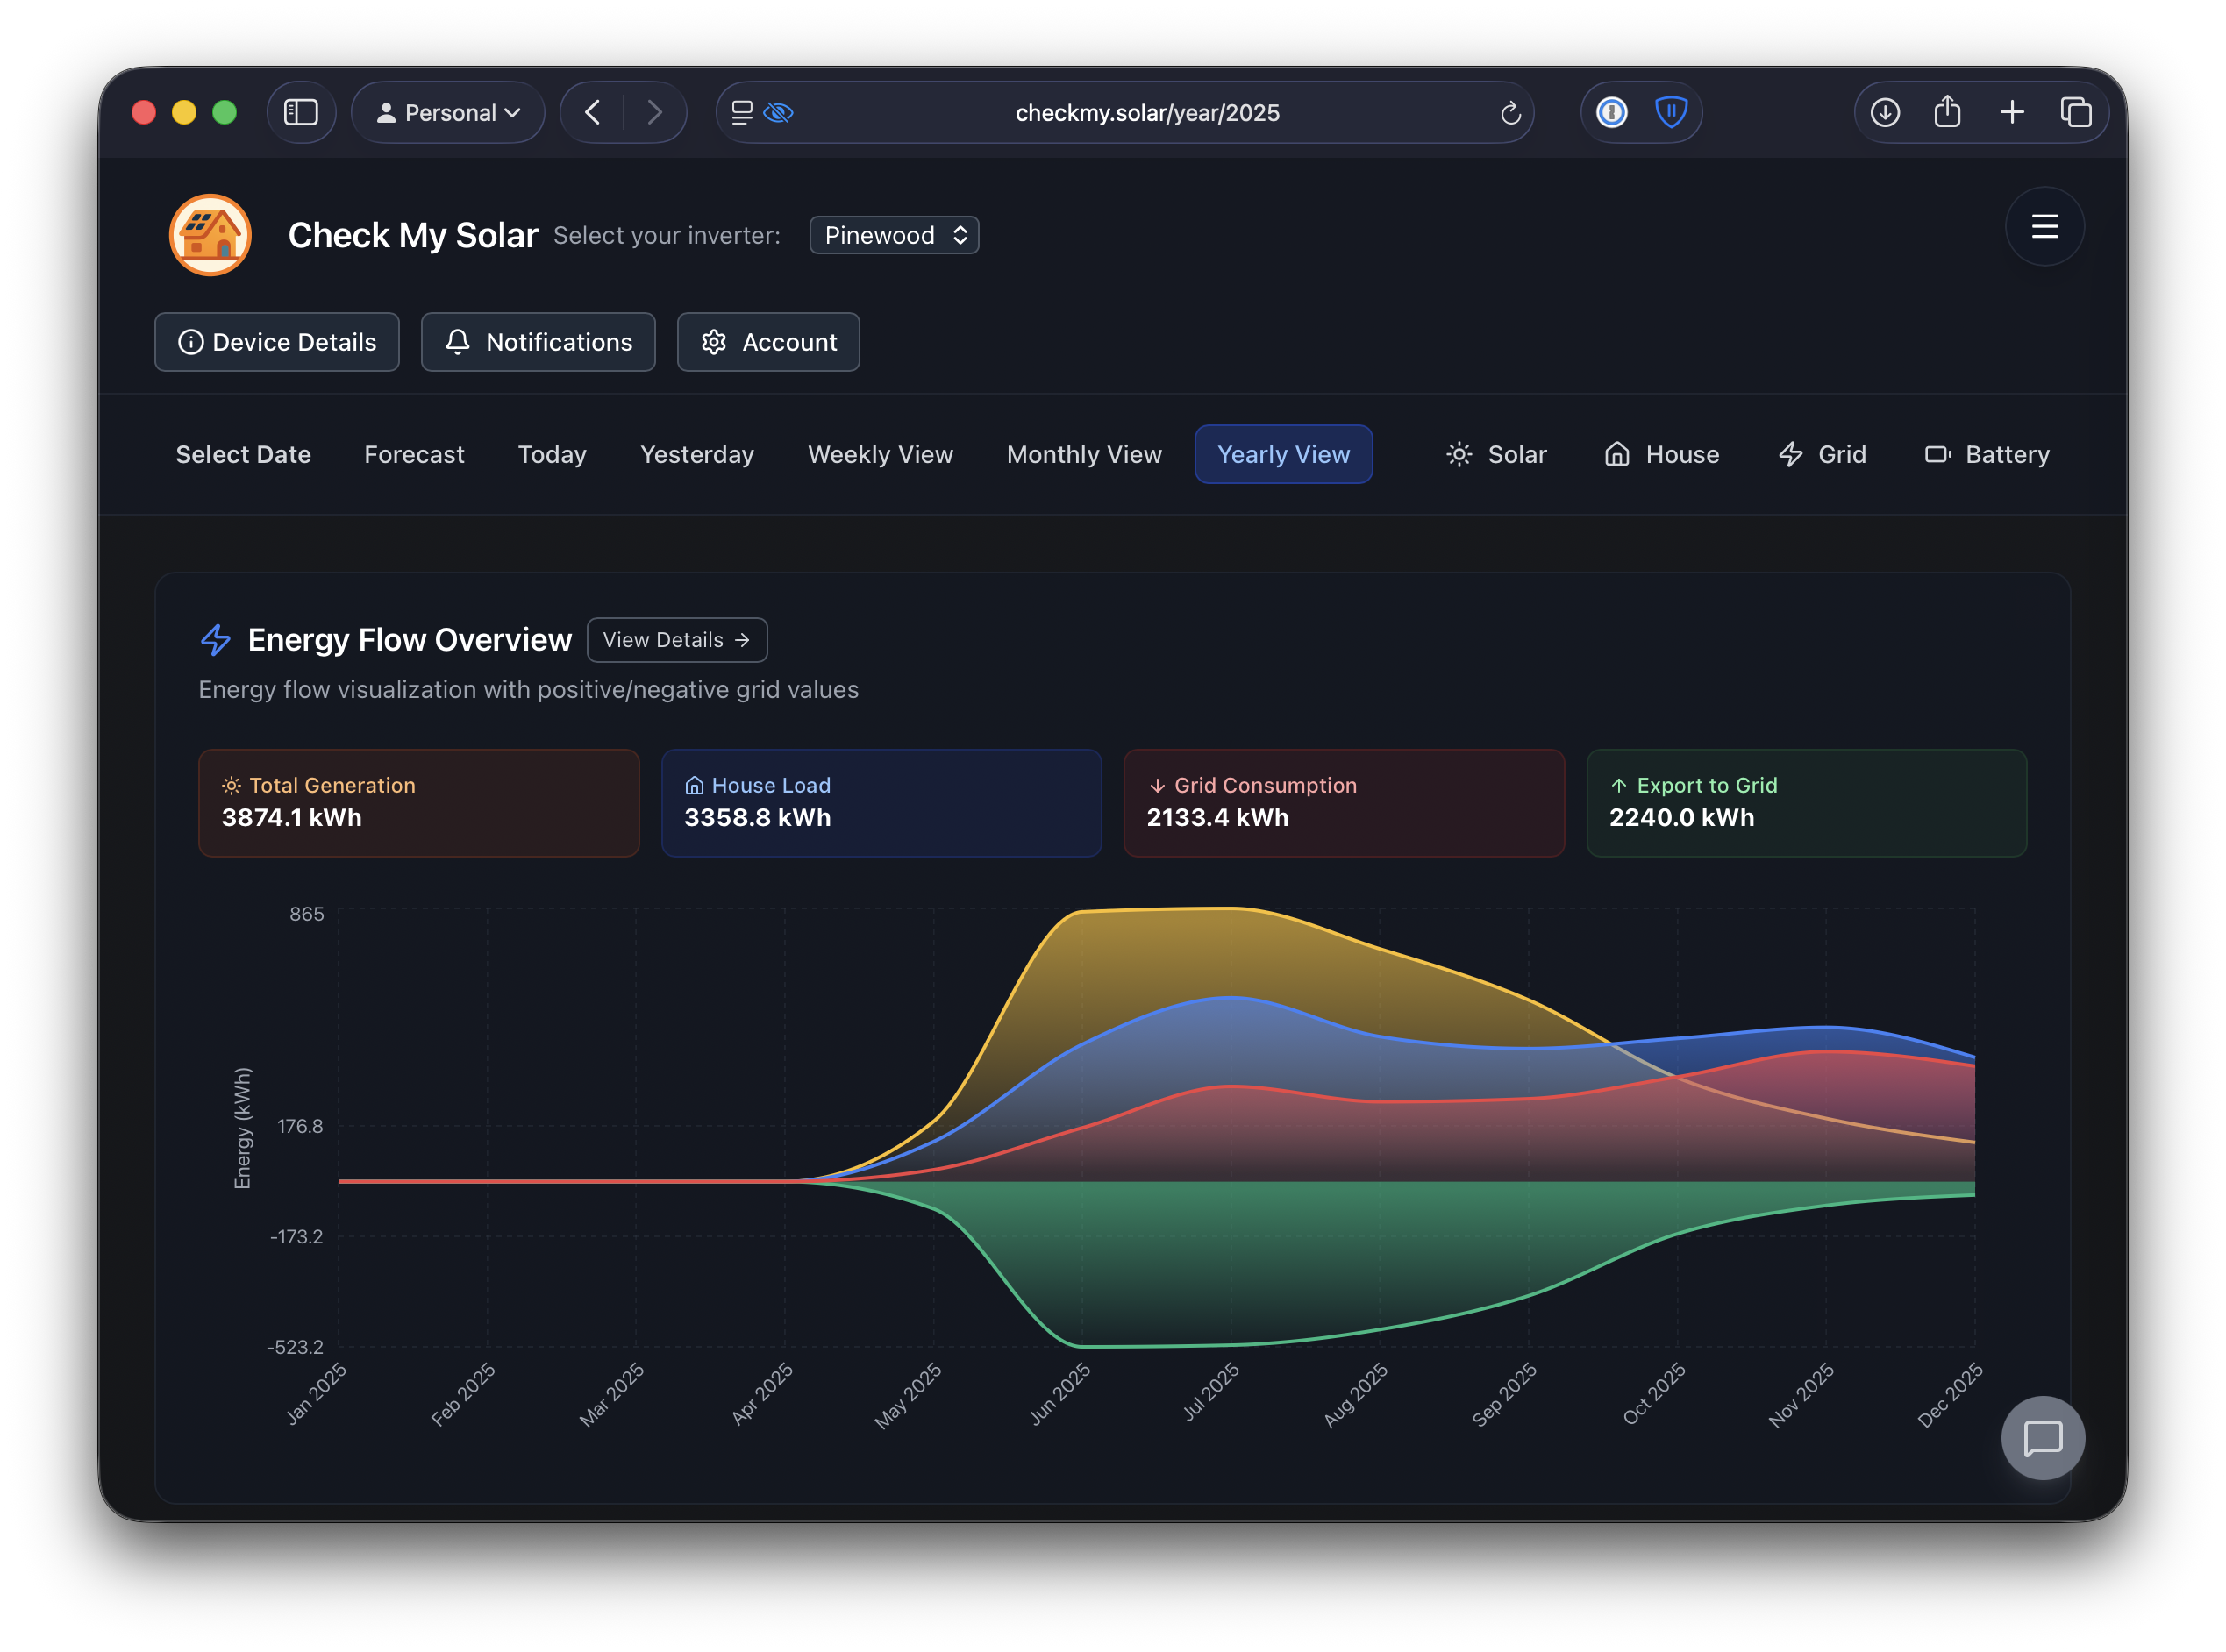
Before I dive in, if you're a Fox ESS owner looking for a better way to monitor your system, I'd highly recommend checking out Check My Solar. An app that I have developed in my spare time; it's the ultimate companion app for Fox ESS solar system owners - get instant access to your solar production, battery status, energy consumption, and grid interaction all in one beautiful, intuitive dashboard.
Available on the App Store or as a progressive web app.
My System Setup#
My solar installation consists of:
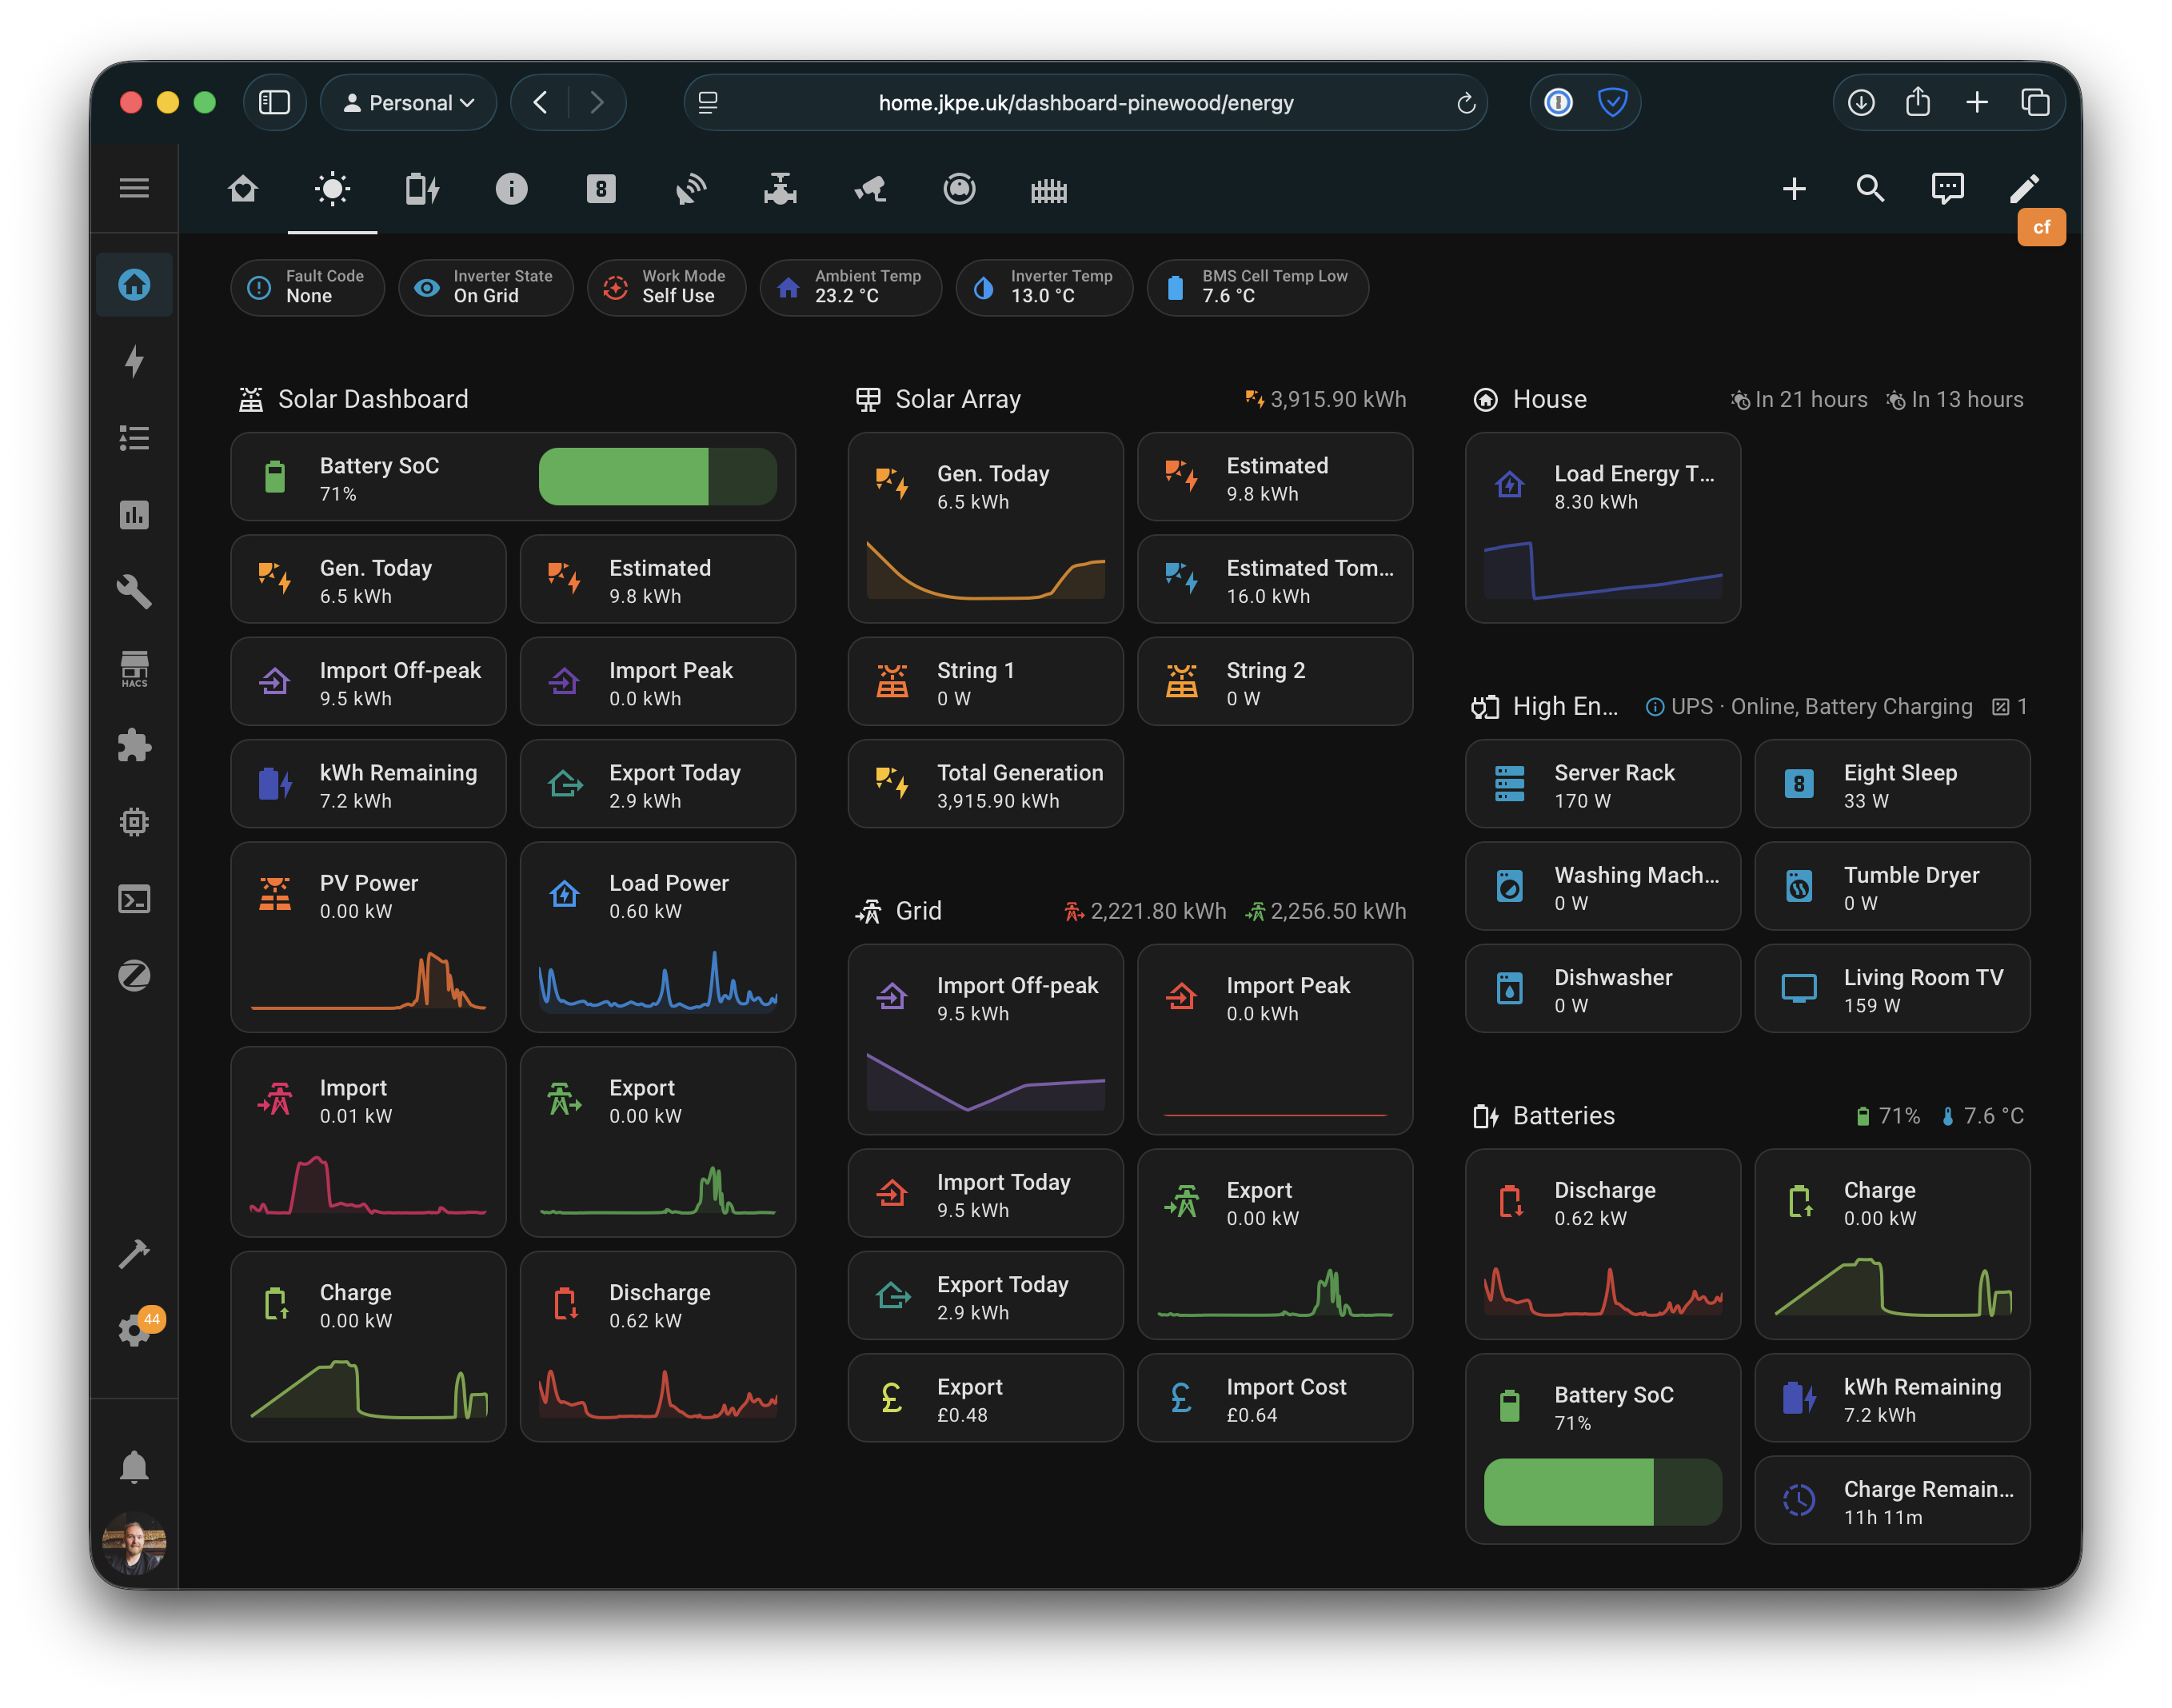
- Inverter: Fox ESS H1 G2 Hybrid
- Panels: 13x Aiko Neostar 2S 460W All Black ABC N-Type Mono
- Storage: Fox ESS EP5 5.18kWh Battery (single battery until November, then upgraded to 2x batteries)
The Fox ESS H1 G2 is a hybrid inverter that handles both solar generation and battery storage. The Aiko 2S panels are high-efficiency modules that have performed exceptionally well even during the gloomy UK winter months.
Solar Generation#
Here's how my solar generation looked month by month:
| Month | Generation (kWh) |
|---|---|
| May 23rd onwards | 190.9 |
| June | 854.2 |
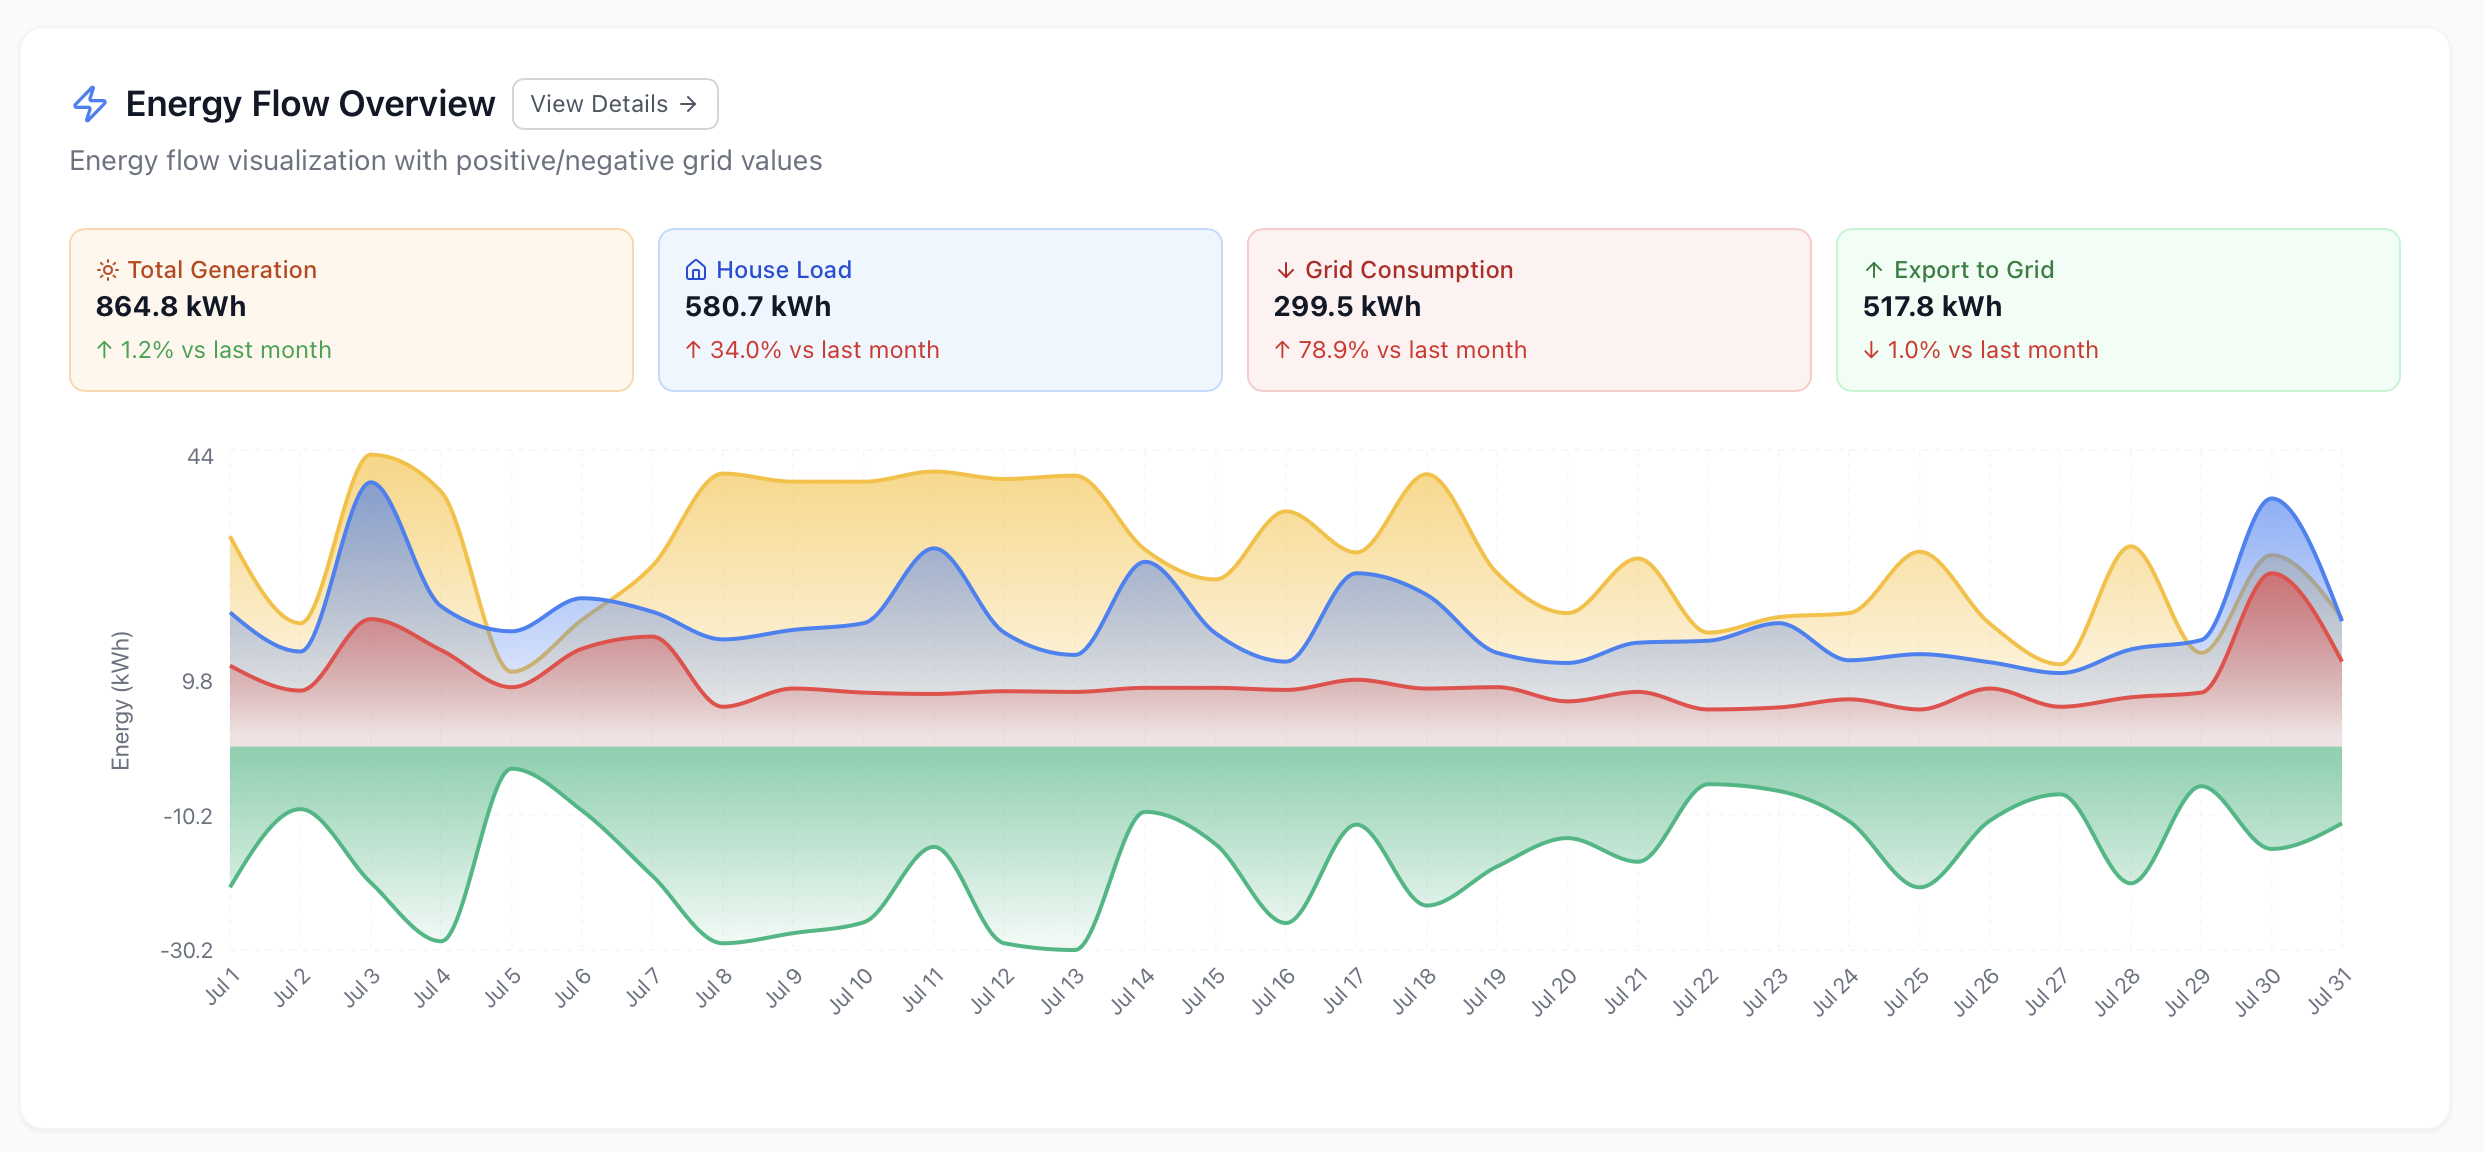
| July | 864.8 |
| August | 736.7 |
| September | 574.8 |
| October | 328.7 |
| November | 199.9 |
| December | 141.8 |
| Total | 3,891.8 |
July was my best month with 864.8 kWh generated - averaging around 28.8 kWh per day. December has been the weakest month so far with 141.8 kWh, but that's still far more than I was expecting.
Peak generation day was July 11th where the system produced 40.8 kWh.
Grid Export & Income#
One of the biggest surprises has been how much I've been able to export back to the grid:
| Month | Export (kWh) | Compensation |
|---|---|---|
| May | 86.2 | £14.22 |
| June | 523.2 | £86.33 |
| July | 517.8 | £85.44 |
| August | 468.3 | £77.27 |
| September | 361.3 | £59.61 |
| October | 165.2 | £27.26 |
| November | 75.7 | £12.49 |
| December | 36.4 | £6.01 |
| Total | 2,234.1 | £368.63 |
I'm on Eon Next export 16.5p kWh - a straightforward fixed-rate export tariff that pays consistently for every kWh I export back to the grid.
Over the 8 months, I've earned £368.63 from exporting excess solar generation back to the grid. That's 58% of my total generation going to the grid.
Grid Consumption - Before vs After#
Before solar, my electricity bills were very high:
January - December 2024 on Octopus
| Month | Consumption (kWh) | Cost |
|---|---|---|
| January | 446.6 | £87.22 |
| February | 388.2 | £75.07 |
| March | 374.3 | £81.73 |
| April | 521.8 | £103.95 |
| May | 522.5 | £115.38 |
| June | 480.5 | £106.62 |
| July | 444.6 | £97.95 |
| August | 430.7 | £91.15 |
| September | 481.0 | £110.43 |
| October | 546.0 | £126.00 |
| November | 767.1 | £185.68 |
| December | 520.8 | £127.65 |
| Total | 5,774.1 | £1,141.73 |
Post-Solar (May - December on E.ON Next)
After switching to E.ON Next with their peak/off-peak tariff structure:
| Month | Peak (kWh) | Off-Peak (kWh) | Total Cost |
|---|---|---|---|
| May | 6.4 | 151.0 | £10.69 |
| June | 11.8 | 289.7 | £22.77 |
| July | 22.0 | 230.9 | £21.73 |
| August | 25.6 | 236.8 | £23.15 |
| September | 57.5 | 273.2 | £34.68 |
| October | 107.5 | 303.2 | £50.91 |
| December | 38.0 | 292.4 | £30.40 |
| Total | 268.8 | 1,777.2 | £194.33 |
The difference is staggering. My average monthly electricity cost went from around £160 before solar to under £30 after installation. The combination of solar generation, battery storage, and smart tariff usage has transformed my energy costs.
Battery Performance#
I started with a single 5.18kWh battery, which I used until November when I added a second battery to double my storage capacity to 10.36kWh. The battery storage has been working hard:
| Month | Charged (kWh) | Discharged (kWh) |
|---|---|---|
| May | 44.7 | 45.2 |
| June | 139.8 | 144.5 |
| July | 140.8 | 140.1 |
| August | 153.9 | 150.0 |
| September | 162.9 | 156.7 |
| October | 171.1 | 163.2 |
| November | 202.8 | 189.7 |
| December | 218.7 | 204.1 |
| Total | 1,234.7 | 1,193.5 |
The efficiency ratio works out to around 96.7% which is excellent for lithium batteries. In summer months, the batteries primarily store excess solar for evening use. In winter, they're increasingly being charged from cheap off-peak grid electricity and discharged during expensive peak hours.
Home Automation & Battery Management#
A key part of maximising the financial benefits of my solar system has been integrating it with Home Assistant for intelligent battery management. I've connected my Fox inverter directly to Home Assistant via Modbus which gives me real-time access to all inverter data - solar generation, battery status, grid import/export, and consumption.
Items used:
The real game-changer has been Batpred - a Home Assistant integration that intelligently manages battery charging based on solar forecasts and tariff rates. Batpred uses weather forecasts to predict solar generation and automatically adjusts battery charge targets to optimise for maximum export income.
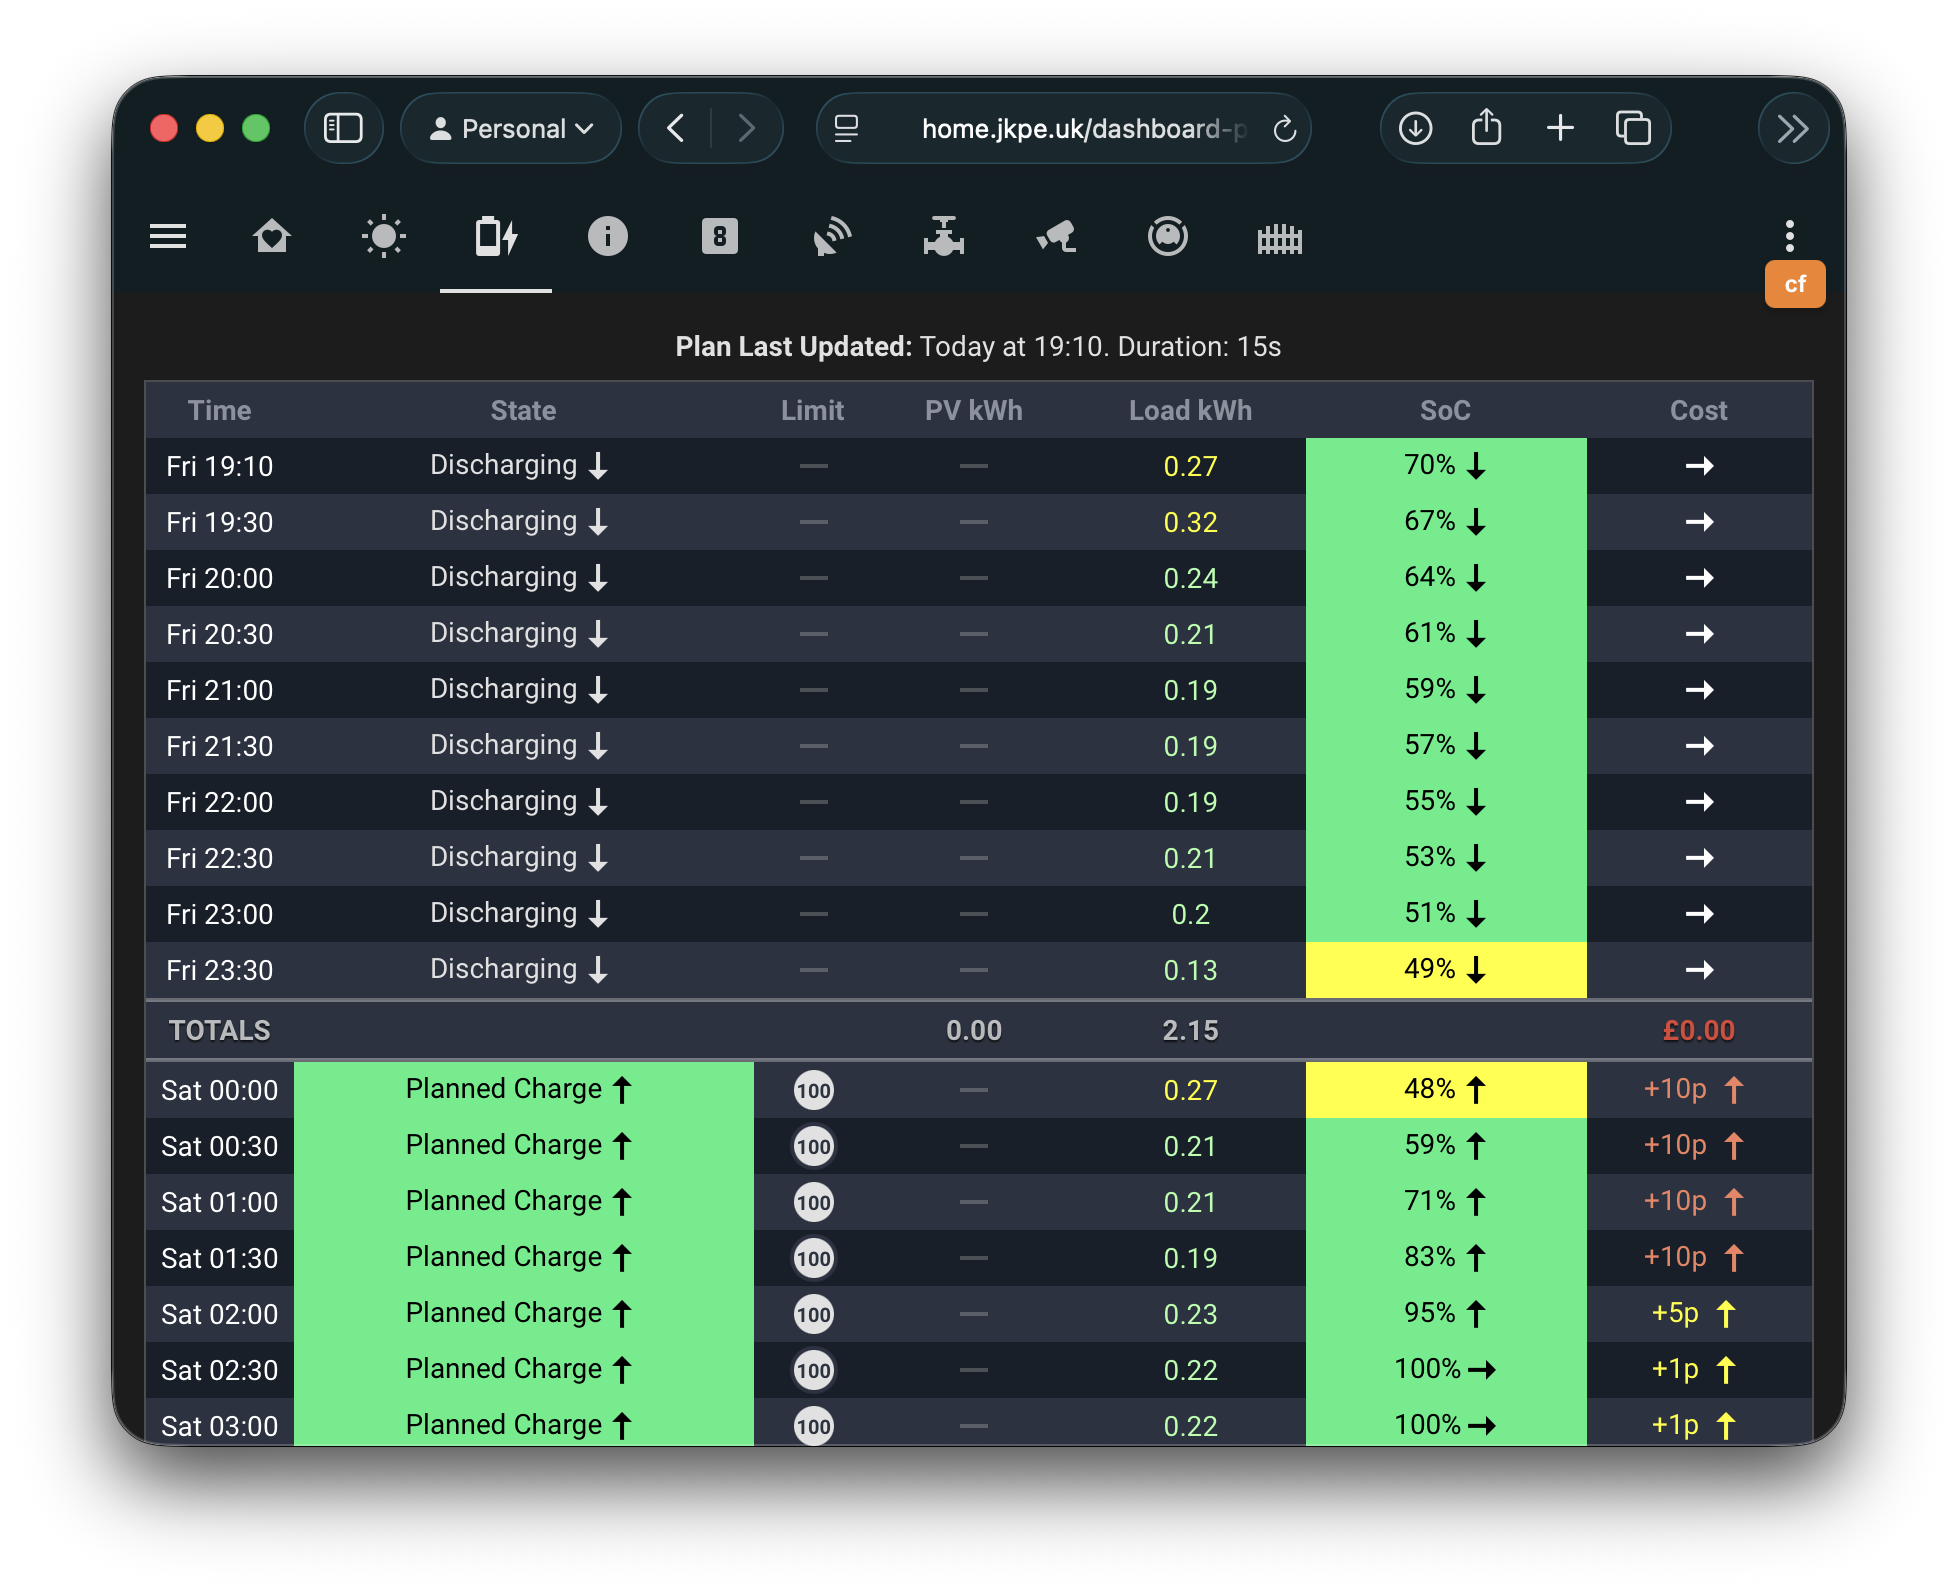
Batpred charges my battery to 100% every night during the off-peak rate period. The battery reaches full charge and holds at 100% until 7am. This strategy maximises profits because on a sunny day, I'm exporting immediately from the moment the sun starts generating - there's no delay waiting for the battery to fill up first. Any solar generation goes straight to export at 16.5p per kWh, while the battery is already full and ready to power the house during peak hours.
Batpred decides weather to charge the battery as soon as the off-peak rate starts at midnight or wait unti later, it does this by calculating the virtual cost of cycling the battery. If I were on a more dynamic tarriff Batpred could also set more dynamic charging and force discharging times.
Total Energy Consumption#
Looking at my total household consumption (grid + solar + battery):
| Month | Total Consumption (kWh) |
|---|---|
| January | 586.3 |
| February | 525.2 |
| March | 771.1 |
| April | 528.5 |
| May | 473.3 |
| June | 514.4 |
| July | 647.8 |
| August | 517.4 |
| September | 469.7 |
| October | 486.3 |
| November | 521.8 |
| December | 382.0 |
| Total | 5,423.8 |
July was my highest consumption month at 647.8 kWh - 116 kWh of that was a hot tub.
Financial Summary#
Let me break down the overall financial picture for 2025:
Electricity Costs:
- Pre-solar (Jan-Apr): £642.04
- Post-solar grid import (May-Dec): £194.33
- Export income: -£368.63
- Net electricity cost (May-Dec): -£174.30 (yes, that's a profit!)
Had I continued without solar, based on my pre-solar consumption patterns, I would have spent approximately £1,900+ on electricity alone. The solar system has effectively saved me over £1,000 in its first 8 months of operation.
If you've got a Fox ESS system and want an easy way to track all these metrics, check out Check My Solar. It's available on the App Store and provides everything you need to understand your solar system's performance at a glance. Beautiful graphs, real-time data, and none of the clunkiness of the official Fox cloud interface.
Feel free to ask any questions about my setup in the comments below. Happy to share more details about specific aspects of the installation or monitoring setup.
Comments